1.Overview
CFD wind power engineering software is a complete set of software package used in wind power field and developed together by Beijing Millennium Engineering Software Co. and China Hydropower Engineering Consulting Group Co., of which the “WindData Validation & Evaluation Software for WindFarm Design” (MWVE) consists of these functions: process and analysis of the anemometry data, generation of wind atlas data, evaluation of the wind resource and calculation of the annual energy production.
2. Characteristics
◇Compatible with international and national anemometry data formats
◇Providing the transforming tool of the format
◇User-defined anemometry data checking regulation
◇Considering the effects of the wind site condition to the anemometry data
◇Kinds of methods to modify the unreasonable data
◇Able to generate and output eligible table and figure
◇Easy to input and output project file, the data can be directly transformed to Excel format
◇In accordance with the practically operating process
3. System Function
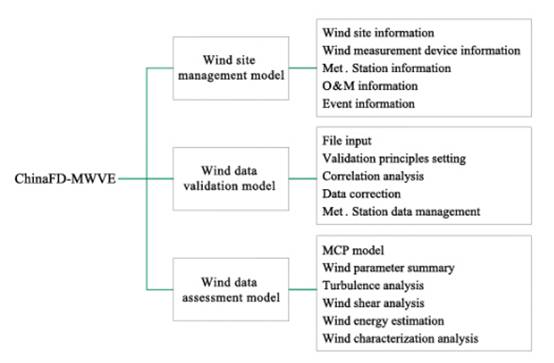
MWVE is based on the wind farmer data, verifies and modifies the raw data, generates wind atlas, estimates the wind resource and wind farm energy production after statistical analysis. It is mainly used for the wind resource measurement and estimation in the Pre-feasibility and feasibility Reports. The system consists of three parts: wind farm management, anemometry data administration, and anemometry data statistic.
Software operation flowchart is as follows:
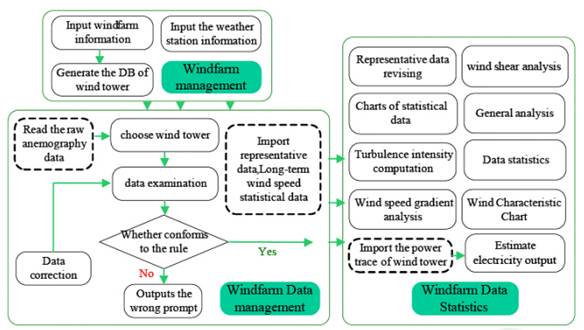
(1)Wind farm management
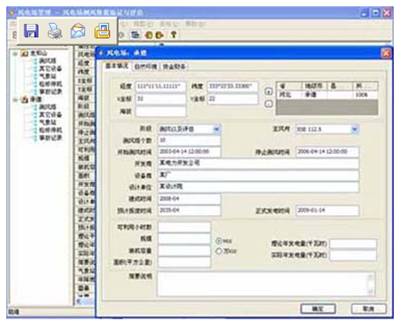
Wind farm management section acts as the initial equipment configuration part. It is the base of the latter input data, consists of information maintenance of wind farm, anemometry mast, and Met. Station, as well as the repair and accident record. The interface is as follows:
(2)Anemometry data administration
AS the main part of the software, it is the main interface of input anemometry data. It completes the wind data input, checking and modifying. It mainly contains the functions of data reading, checking regulation settings, correlation analysis, data modification, Met. Station data management and so on. The interface is as follows:
◇ Anemometry data input

◇ Checking regulation settings

(3)Anemometry data statistic
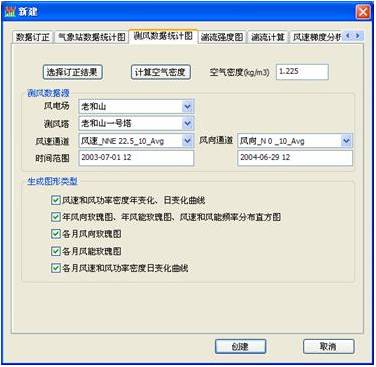
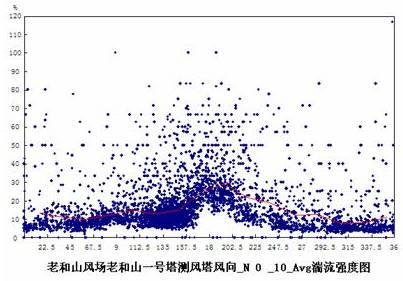
This part achieves the function of data analysis and results export. It mainly contains data correction of representative year, turbulence analysis, coarse estimation of energy production, providing report of data quality checking, manual modification of data and processing sundry parameters needed in wind resource evaluation.
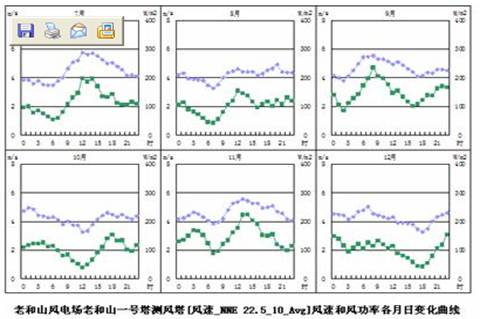
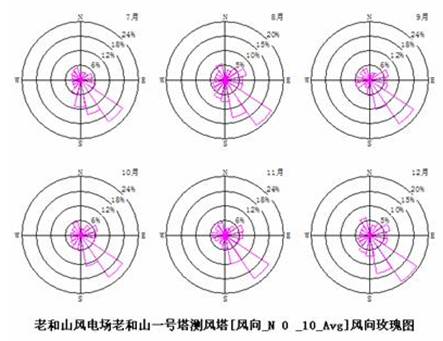
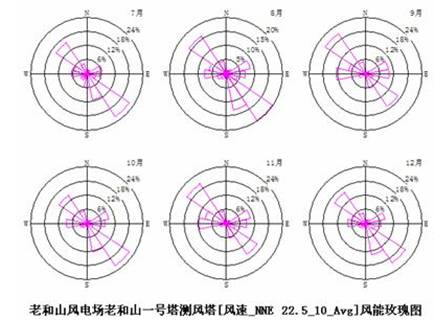
In addition, MWVE can generate kinds of charts as needed, provide turbulence calculation based on the national and international standard, wind gradient analysis, wind shear exponent calculation, anemometry data statistics and hour averaged wind speed statistics. The results can be directly copied into the Excel file.
The generated charts include:
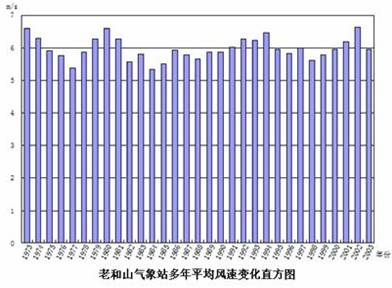
Multi-year average wind speed variety histogram
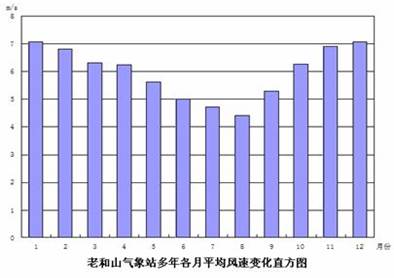
Years of monthly average wind speed histogram
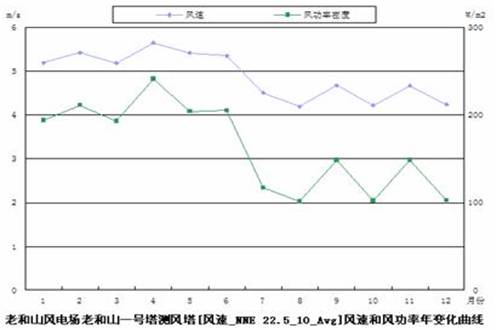
Annual variety curve of wind speed and wind power density
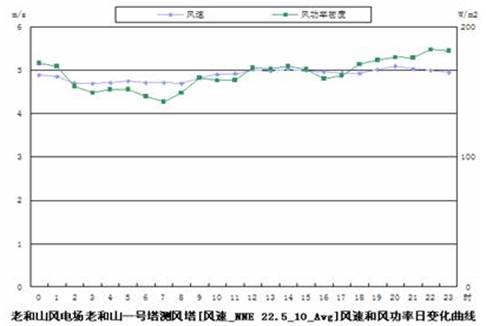
Daily variety curve of wind speed and wind power density
Daily variety curve of wind speed and wind power density in every month
Annual wind director rose, wind energy rose, wind speed and wind energy frequency distribution histogram

Monthly wind director rose
Monthly wind energy rose
Turbulence intensity scatter diagram
After input the wind turbine, the theoretical energy production can be calculated coarsely in the “energy production estimation”.