1. Software Overview
CFD wind power engineering software is a complete set of software package used in wind power field and developed together by Beijing Millennium Engineering Software Co. and China Hydropower Engineering Consulting Group Co., of which the "Wind Energy and Production Analysis Software for WindFarm Design" software is mainly used for the wind farm pre-construction. Through the numerical simulation of historical data, and diagnostic analysis of anemometry data, WEPAS accesses wind resource parameters of arbitrary spatial location in wind farm region and comprehensively analyses and evaluates the energy production. It can make the wind resource assessment for China's large-scale wind farm development, provide reliable basis information for large-scale commercial wind farm feasibility research and project proposals, and improve the competence of China's domestic consultation and design organization in wind resource assessment and wind field evaluation.
2. Software Characteristics
1) Basing on the three-dimensional wind field diagnostic mode (WINDIAM):
Different with the wind dynamics forecasting models, WINDIAM actually constructs the three-dimensional wind field through the observational data. It diagnoses an hourly three-dimensional wind field bounded by the continuity equation, based on the Met. Station data and terrain information.
2) Provide two analytical modes for single anemometry mast and Multi- anemometry mast:
Users can choose different modes to analyze the wind resource so as to make use of the observed data as more as possible.
3) In line with the actual wind field situation:
As the model uses more practical anemometry data, simultaneously the use of continuity constraint equation is also conducive to partly reflect the effects of terrain to flow and eliminate the deficiency and mistake of some anemometry data. So, the diagnostic wind field has a good representation for the actual situation.
4) High integrity rate and reliability of anemometry data:
Anemometry data is verified and modified through WEPAS, with high integrity rate and reliability.
5) Estimation of parameters of Weibull distribution:
Calculate the parameters of Weibull distribution for all points on the grid map, and then export the result files which can be used for turbine optimization calculated in the “CFD-WMS” and “windfarmer” softwares.
6) Applicable to the characteristics of monsoon climate in our country:
Using the multi-storey anemometry information of anemometry mast, it separately calculates boundary layer wind profile exponent under different atmospheric stability, so that make the experienced law of wind profiles much more refined. It is applicable to the characteristics of monsoon climate in our country.
7) Acceptance by expert panel:
The software was accepted by several domestic and international experts from National Development and Reform Commission, National Energy Administration, China Meteorological Bureau, China Hydropower Engineering Consulting Group Co., and China Wind Energy Association.
8) Easy to operate:
It can provide kinds of turbine layout methods, and directly generate the content needed in the preparation of the pre-feasibility reports and the feasibility reports. The content of the reports can be directly exported to Word file format.
3. Software Function
WEPAS calculates wind resource of arbitrary spatial location in wind farm through three-dimensional wind field diagnostic model basing on the anemometry data, satellite-to-earth observation data and the impact of terrain surface roughness on the wind. At the same time, according to the wind resource data, wind turbine power curve and the wake impact to calculate energy production of each turbine.
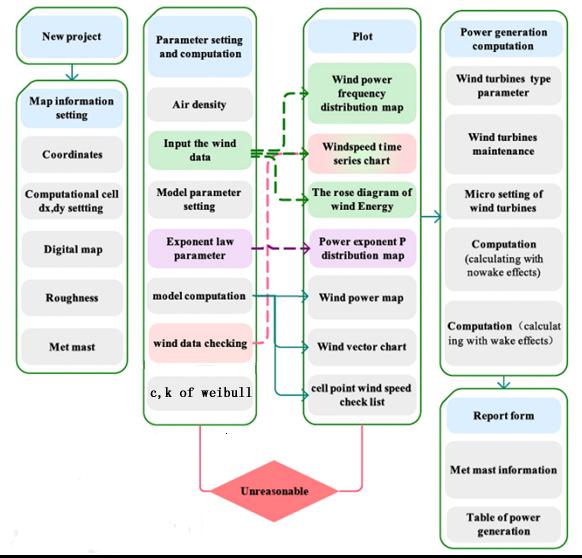
WEPAS mainly includes four major parts: terrain information processing, mode analysis, energy production generation and graphics reports, as shown below

Software operation flowchart is as follows:
(1) Topographic information processing
This section mainly includes: terrain map import, anemometry mast settings, roughness settings, introduced as follows.
◇Anemometry mast settings: The module's main function is setting the anemometry mast according to the actual geographical coordinates. Users can click the button to add, delete and move the anemometry mast.
◇Roughness settings: The module's main function is setting the roughness basing on the actual geographical situation. Users can select the region and set the corresponding roughness (roughness ranges from 0 to 1, users are free to choose) according to the actual situation, then compute and generate the grid roughness basing on the regional roughness.
The main interface is as follows:

(2) Mode calculation part
Mode calculation is the core of this software, including: anemometry data import, mode parameter settings, mode calculation, estimation of Weibull distribution parameters, introduced as follows.
◇Anemometry data import: Be able to import the anemometry data of corresponding mast, which is processed by the "WindData Validation & Evaluation Software for WindFarm Design” (MWVE)" software.
◇Mode parameters settings:The module's main function is to set up and calculate various parameters required in the mode, including map parameters, high-altitude geostrophic wind, atmospheric stability and wind shear exponent.
◇Calculation of mode: The module's main function is to calculate the wind speed, wind direction, and monthly (yearly) mean wind speed and wind power density of setting height on the grid location. Single mast mode and multi-mast mode can be calculated in mode calculation.
◇Estimation of parameters of Weibull distribution:Calculate the parameters of Weibull distribution for all points on the grid map, and then export the result files which can be used for turbine optimization calculated in the “CFD-WMS” and “windfarmer” softwares
The main interface is as follows:

(3) Energy calculation part
Be used to calculate the entire wind farm production, mainly including the turbine settings and energy production calculation.
◇ Turbine settings: Setting turbine type, turbine location, and be able to import the turbine site as EXCEL format. On the map, according to the actual geographic situation and wind distribution, be able to select the turbine, and realize single turbine settings and territorial turbine settings (automatic arrangement according to prevalent wind direction). In addition, the property of single and regional turbine can be modified.
◇ Energy production calculation: The energy production calculation consists of no wake and Wake cases. The system generates power reports after calculation, and thus convenient for users to assess the wind farm.
(4) Plotting and Report forms
This model is mainly plotting all kinds of wind atlas, including two types of graphs. First, plot probability distribution graph, the time-series chart, the wind rose and so on based on the anemometry data, such graphs are mainly used to reflect the general situation of the wind farm and check the validity of the measured data. Second, according to the data calculated by the mode, plot the spatial distribution maps of yearly (monthly) mean wind power density, wind vectors and so on, such graphs are mainly used to show the detail distribution of wind energy resources in wind farm, thereby to select turbine site. Here are some graphical interfaces:
◇Probability distribution chat of wind speed (wind power density):

◇Spatial distribution graph of wind speed (wind power): Show different colors according to the wind size, then quickly distinguish the effective wind areas, that is convenient for the wind farm selection.

◇ Wind rose diagram: According to wind energy's share of 16 different directions, drawing sector charts

◇ Wind speed time-series chart: monthly average wind speed time-series chart of all heights

◇ Wind vector chart: Providing hourly wind vector chart

◇ Wind speed map of the grid: You can see the wind speed of a grid at different height at a certain moment

◇ Report forms of anemometry mast information: Includes maximum wind speed and the corresponding appearance time, mean wind speed, mean wind power density and other information of the anemometry mast at different height, according to different statistical methods (by all data, by monthly Statistics). And show basic information and statistical information of anemometry mast in detailed information list.
◇ Report forms of energy production: Including energy production statistics of all the wind turbine, energy production statistics of single wind turbine, wind speed and wind direction statistics.
(5) Map editor
The function is including map conversion and cutting.
◇Map conversion: Transforming DXF format to the WFM format. Selecting the contour lines layer when conversing.
◇Map cutting: Cut down the region of the wind farm that must be calculated, so that reducing computation and improving work efficiency.
